
![ASM[04] — [x86-64] Assembly Language: Introduction to GDB Debugging and CPU Registers](https://appsecwriteups.com/wp-content/uploads/2026/10/Screenshot-2026-10-17-at-8.55.40-AM-Redactly.pics-redacted-Redactly.pics-redacted-1-scaled.png)
Hello, and welcome to the next topic in our x86-64 Assembly Language series. I’m Jivan, and in this write-up, we’ll continue learning x86-64 Assembly step by step.
In the previous articles, we covered the basics of x86-64 Assembly, including its structure, syntax, sections such as .data and .text, and instructions. We also explored Linux system calls, including read and write.
In this write-up, I’ll introduce GDB (GNU Debugger), a tool that helps us analyze and debug assembly executables. We’ll use GDB to execute our program step by step, inspect register values, and understand how our assembly instructions work.
I hope you enjoy this next part of the x86-64 Assembly series. Happy learning!
Let’s Create Our Assembly Program
Let’s start by creating our Assembly program. Since you are already familiar with the basics of Assembly, I won’t explain the program in detail in this write-up. I’ve already covered these concepts in my previous articles.
However, I’ll briefly explain the code again to help you understand how to use GDB.
I’ve created a very simple program that copies a value from one register to another. You can refer to the attached screenshot to see the Assembly code we’ll use for this exercise.
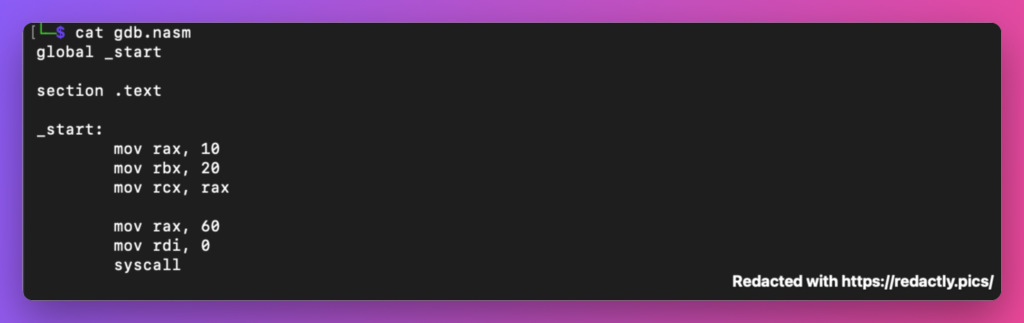
As you can see in the screenshot above, I have created a file named gdb.nasm with the following code.
The program contains a .text section where I have written several mov instructions using the RAX, RBX, and RCX registers. The instruction mov rcx, rax copies the value stored in RAX into RCX.
At the end of the program, I use the syscall instruction to exit the program. Before executing syscall, I set RAX to 60, which is the Linux system call number for exit, and RDI to 0, which represents the exit status.
Advanced Real Bug Bounty Case Studies – Volume 1
Learn bug bounty hunting through real vulnerability case studies. Discover how XSS, HTML Injection, IDOR, and Broken Access Control vulnerabilities are identified, validated, and responsibly reported using practical, real-world examples instead of intentionally vulnerable labs.
Building the Executable
To build our executable, we first need to assemble the source code into an object file using the following command:
nasm -f elf64 gdb.nasm -o gdb.oThis command creates an object file named gdb.o. Next, we use the ld linker to link the object file and generate the executable:
ld gdb.o -o gdbThis creates our executable file named gdb, which we can run using:
./gdbYou can refer to the attached screenshot to see these commands in action.
Note for Apple Silicon Mac users: If you are using an Apple Silicon MacBook (M-series chip) with an Ubuntu virtual machine, your setup may require a different approach because the host uses ARM64 architecture while this program targets x86-64. Please refer to my previous write-ups about setting up and running the Ubuntu environment through QEMU for the relevant instructions.
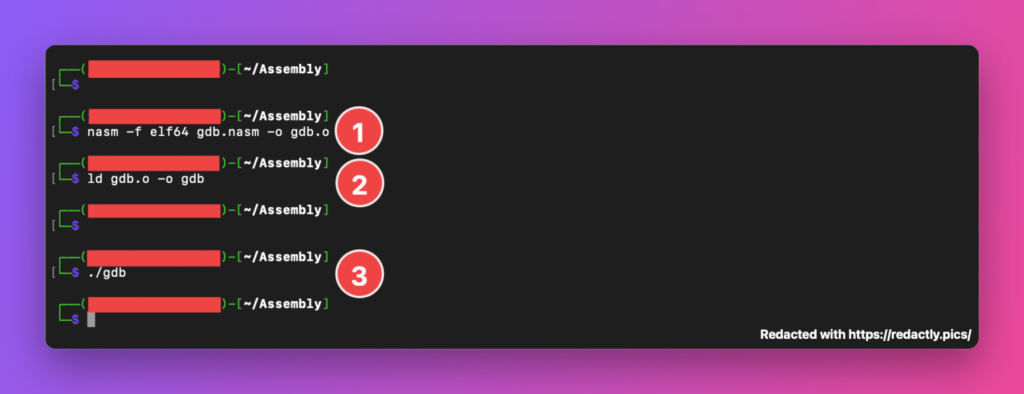
Note: I have named our executable file gdb. Please don’t confuse this file with the GDB debugging tool.
When we run gdb ./gdb, the first gdb refers to the GDB debugging tool, while ./gdb refers to our executable file. Here, ./ specifies that the executable is located in the current directory.
You can choose a different name for your executable if you prefer. For example, you could name it program and run it with gdb ./program instead.
As you can see in Step 3 of the screenshot above, when we run our program using ./gdb, it doesn’t display any output on the screen.
This is because our program doesn’t use the read or write system calls to receive input or display output. Instead, we have created a simple program that copies values between registers using the mov instruction.
So, how can we see these register values and understand how they change during program execution? This is where GDB (GNU Debugger) comes in.
Let’s use GDB to inspect our executable and see how the program works, one instruction at a time.
Starting GDB
Now, let’s start GDB and inspect our executable. To do this, run the following command in your terminal:
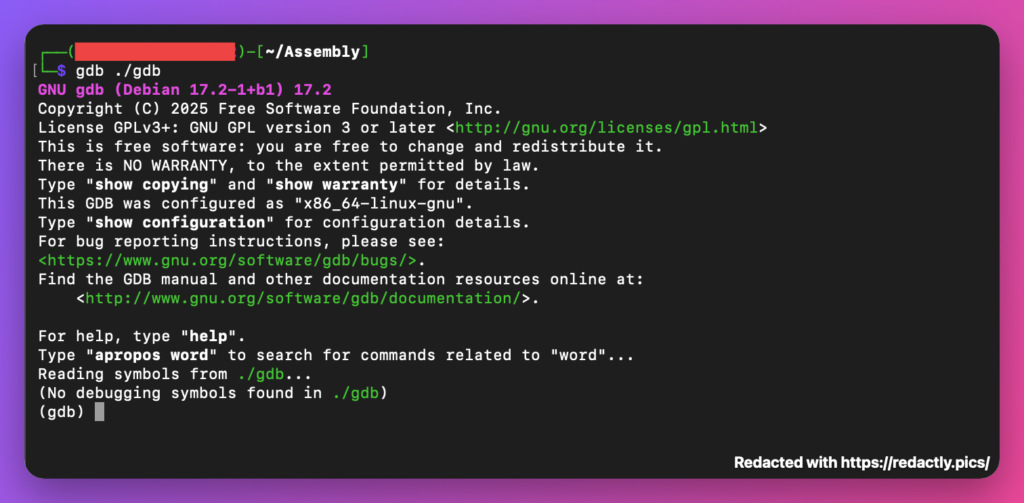
gdb ./gdbHere, gdb is the GNU Debugger tool, and ./gdb is the executable file we created earlier.
Once you run this command, GDB will start and load our executable for debugging. You should see output similar to the screenshot below.
Now, let’s configure GDB to display our assembly instructions in Intel syntax. For this, we use the following command:
set disassembly-flavor intelNext, we need to tell GDB where to pause our program before execution begins. We can do this by setting a breakpoint at the _start label using the following command:
break _startThis sets a breakpoint at the location where _start is defined in our executable. When we run the program, GDB will pause at this breakpoint before executing the first instruction.
To start the program under GDB, we use the run command:
runGDB starts executing our program and stops at the _start breakpoint, allowing us to inspect the program before its first instruction executes.
As you can see in the attached screenshot, these commands prepare our executable for debugging and let us begin inspecting its instructions with GDB.
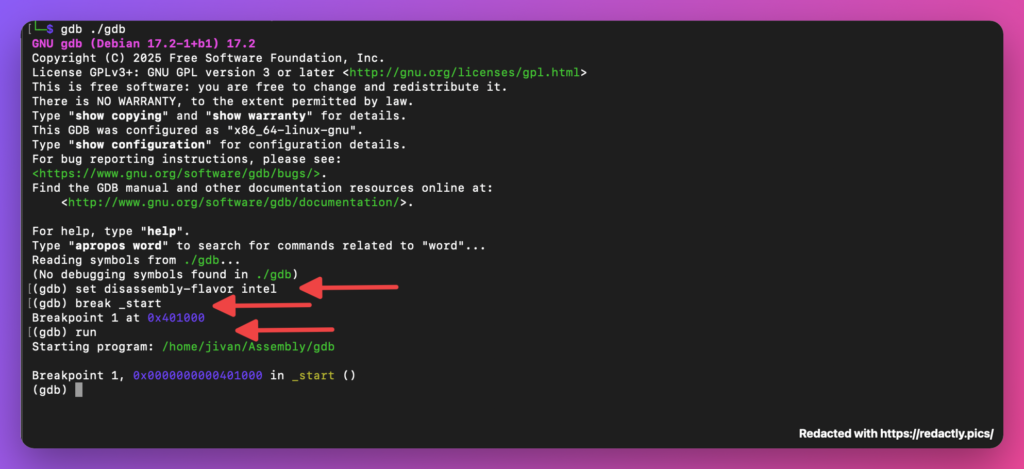
As you can see in the screenshot above, when we execute break _start, GDB sets a breakpoint at the address 0x401000. This is the memory address where the _start label is located in our executable.
After running the run command, GDB displays the same address, sometimes in a longer format:
0x401000
0x0000000000401000
Both represent the same memory address. The additional zeros at the beginning do not change the address’s value, so you can read 0x0000000000401000 as 0x401000.
Advanced Real Bug Bounty Case Studies – Volume 1
Learn bug bounty hunting through real vulnerability case studies. Discover how XSS, HTML Injection, IDOR, and Broken Access Control vulnerabilities are identified, validated, and responsibly reported using practical, real-world examples instead of intentionally vulnerable labs.
Understanding the address format
The 0x prefix indicates that the number is written in hexadecimal (base 16) rather than decimal (base 10). Hexadecimal uses the digits 0–9 and letters a–f.
For example:
0x10in hexadecimal equals16in decimal.0x100in hexadecimal equals256in decimal.0x401000is a hexadecimal memory address where our_startlabel is located in this executable.
Because we are working with x86-64, GDB can display addresses using 16 hexadecimal digits, corresponding to 64-bit address formatting. Leading zeros may be included to make the representation consistent.
Important: 0x401000 is the address in this particular executable, not a fixed address for every program. The address may differ depending on how the executable is linked and whether address randomization is enabled.
Now, let’s use the disassemble command, which displays the assembly instructions of our executable or a specific function within a program.
disassembleThis displays the assembly instructions associated with the _start label, along with their memory addresses and instruction offsets.
As you can see in the attached screenshot, GDB displays the instructions that make up our program, allowing us to inspect them before stepping through their execution.
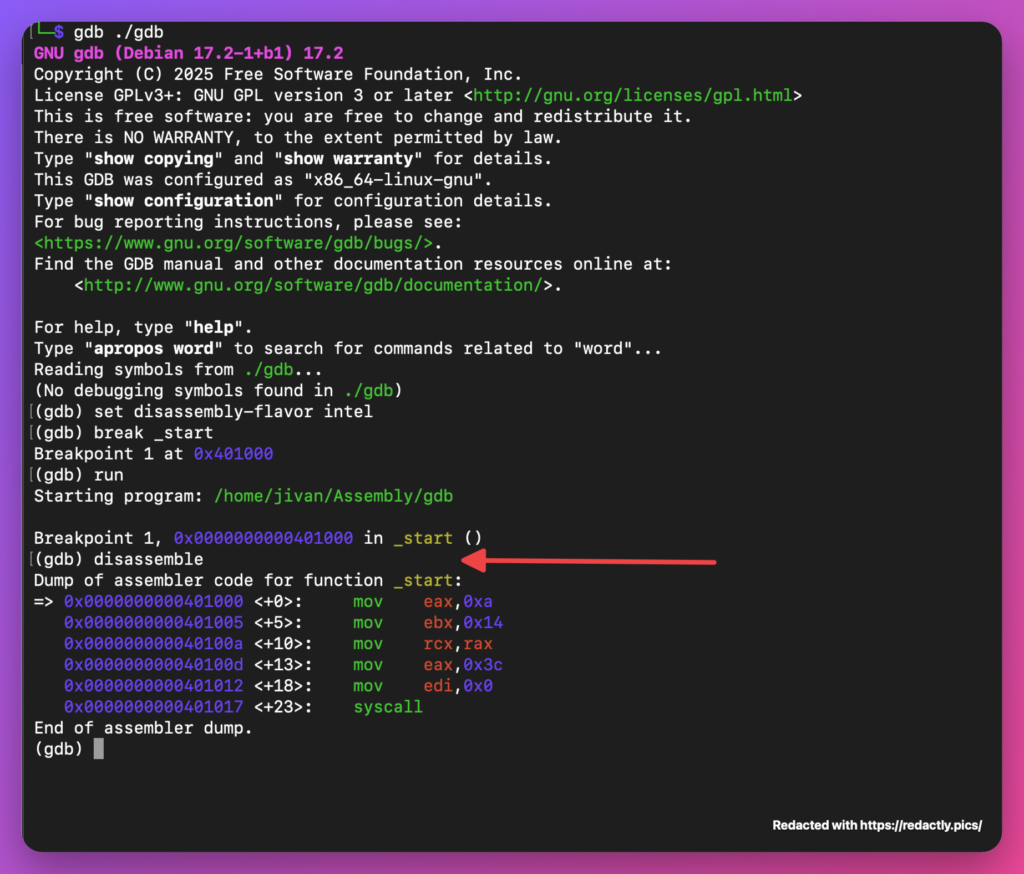
As you can see in the screenshot above, the disassemble command displays the assembly instructions of our executable along with their memory addresses and offsets.
You can also see the => symbol pointing to the instruction at address 0x401000. This is the same address where we previously set the breakpoint using break _start. The => symbol indicates the current instruction where GDB is paused, which corresponds to the address stored in the RIP register. In this example, the first instruction has not yet executed.
The RIP (Instruction Pointer) register holds the address of the current instruction in an x86-64 program. When execution is paused in GDB, RIP indicates the instruction that will execute next. As we step through the program using the si command, RIP updates to point to the next instruction.
The => symbol indicates the current instruction where GDB is paused. Since our program has stopped at the _start breakpoint, the first instruction has not yet executed.
This helps us identify exactly where our program is positioned before we begin stepping through the instructions.
(gdb) disassemble
Dump of assembler code for function _start:
=> 0x0000000000401000 <+0>:	mov    eax,0xa
   0x0000000000401005 <+5>:	mov    ebx,0x14
   0x000000000040100a <+10>:	mov    rcx,rax
   0x000000000040100d <+13>:	mov    eax,0x3c
   0x0000000000401012 <+18>:	mov    edi,0x0
   0x0000000000401017 <+23>:	syscall
End of assembler dump.
(gdb)
As you can see, GDB displays our x86-64 assembly instructions along with their memory addresses. The => symbol points to the current instruction where the program is paused. In our example, it points to address 0x401000 because we set a breakpoint at _start.
When we execute the first instruction using the si command, GDB moves the => symbol to the next instruction at address 0x401005. This continues as we step through the program, allowing us to observe each instruction’s execution.
Now, let’s look at the first instruction in our gdb.nasm source code:
mov rax, 10However, GDB displays it as:
mov eax, 0xaYou might wonder why GDB displays eax instead of rax, and 0xa instead of 10. Let’s understand both differences.
Why does GDB display EAX instead of RAX?
RAX is a 64-bit register, whereas EAX refers to its lower 32 bits. In x86-64, writing to EAX automatically clears the upper 32 bits of RAX.
For our instruction, the value 10 fits within 32 bits, so NASM can use a shorter machine-code encoding that writes to EAX. This produces the same resulting 64-bit register value as mov rax, 10.
However, when an instruction needs to load a full 64-bit value, the assembler may need to use an encoding that explicitly writes to RAX.
Why does GDB display 0xA instead of 10?
The reason is that GDB displays immediate values in hexadecimal notation in this disassembly.
In the decimal number system, we use the digits 0–9. In hexadecimal, we use 0–9 and the letters A–F, giving us 16 symbols.
Here are some examples:
| Decimal | Hexadecimal |
|---|---|
| 9 | 0x9 |
| 10 | 0xA |
| 11 | 0xB |
| 12 | 0xC |
| 13 | 0xD |
| 14 | 0xE |
| 15 | 0xF |
| 16 | 0x10 |
The prefix 0x indicates that a number is written in hexadecimal. Therefore, 0xA is equal to decimal 10, and both represent the same value.
I hope this clears up why GDB displays eax and 0xa instead of rax and 10 in our disassembly output.
Inspecting Registers in GDB
Now, let’s inspect the CPU registers using the following GDB command:
info registersThis command displays the current values of the CPU registers, including RAX, RBX, RCX, RIP, and RSP.
As you can see in the attached screenshot, our program is still paused at the first instruction:
mov eax, 0xaSince we haven’t executed this instruction yet, the value 10 has not been loaded into RAX by this instruction.
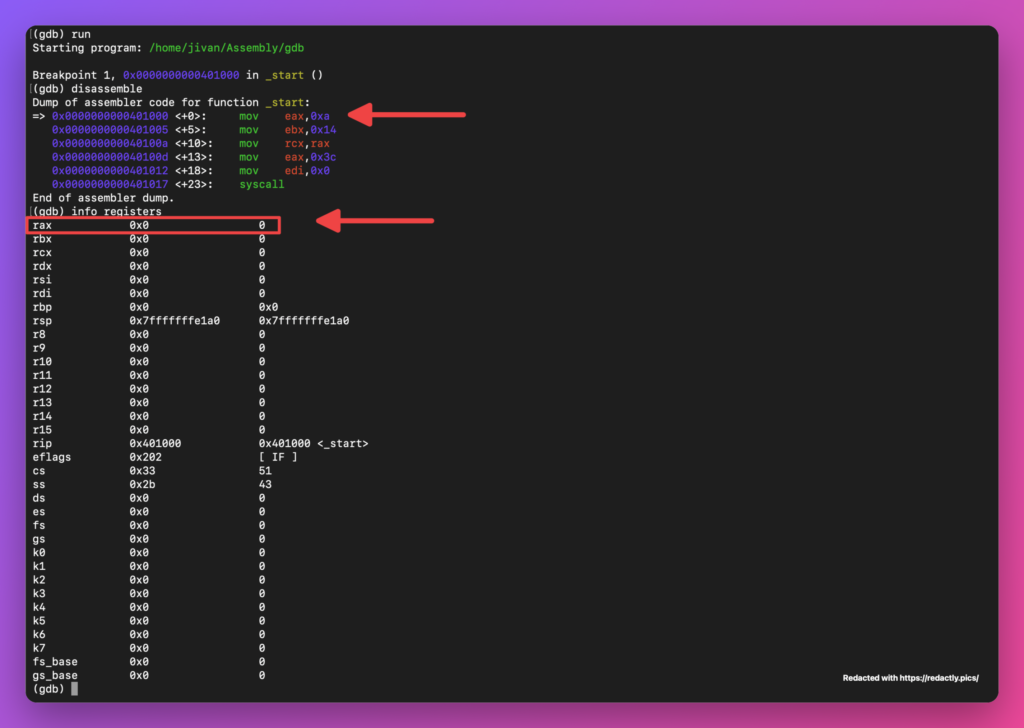
Remember that EAX represents the lower 32 bits of RAX. When an instruction writes to EAX, the upper 32 bits of RAX are automatically cleared. However, this only happens after the instruction executes.
To observe the change, execute the instruction using:
siThen inspect the register again:
info registersYou should now see RAX containing 0xa, which is decimal 10.
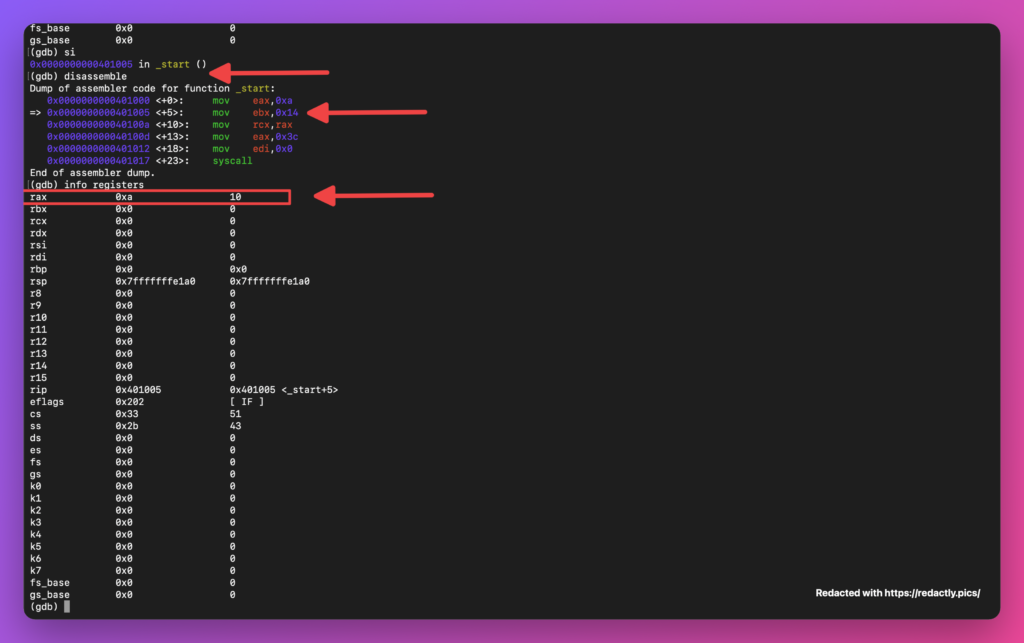
As you can see in the screenshot above, the RAX register now contains 0xa, which is decimal 10. This is because we executed the instruction at address 0x401000 using the si command, which steps through one instruction at a time.
Advanced Real Bug Bounty Case Studies – Volume 1
Learn bug bounty hunting through real vulnerability case studies. Discover how XSS, HTML Injection, IDOR, and Broken Access Control vulnerabilities are identified, validated, and responsibly reported using practical, real-world examples instead of intentionally vulnerable labs.
After executing the instruction, I used the disassemble command to view the instructions again and identify the next instruction to execute. Then, I used info registers to check the register values and confirm that RAX now contains 0xa.
You can repeat this process by using the si command one instruction at a time and checking the registers with info registers. You will see how the register values change as each instruction executes, until the program reaches the syscall instruction and exits.
One more thing: you can also check specific registers by using the info registers command followed by the register names. For example, info registers rax rbx displays the current values of only the RAX and RBX registers.
Let’s try it. Since we have already executed the first instruction, RAX contains 0xa, which is decimal 10. RBX, however, still contains its current value because we haven’t executed the instruction that assigns 20 to it yet.
Unlike info registers, which displays all the registers and their current values, specifying register names lets you inspect only the registers you want to check. Let’s use this command to examine RAX and RBX.

As you can see, RAX contains 0xa (decimal 10), while RBX contains 0x0.
Now, let’s use the si command to execute the next instruction, mov ebx, 0x14. This instruction loads the value 0x14 (decimal 20) into EBX. Since EBX is the lower 32 bits of RBX, writing to EBX also clears the upper 32 bits of RBX.
After executing the instruction, check the register values again. You should see that RBX now contains 0x14, which is decimal 20.
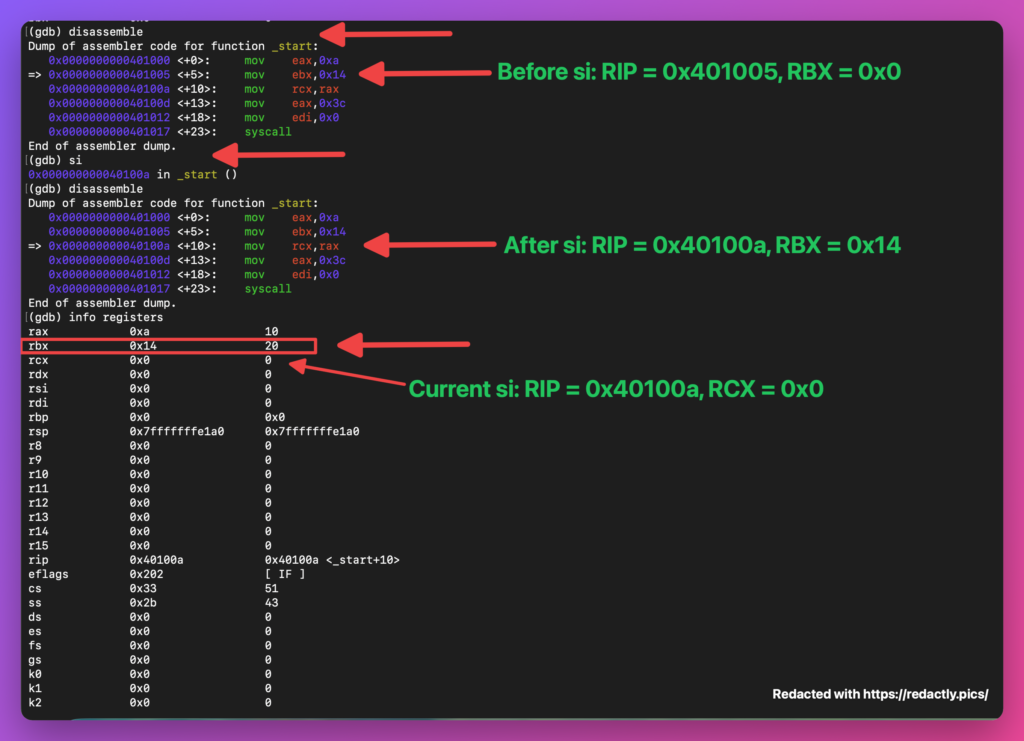
As you can see in the screenshot, before executing si, RIP points to address 0x401005. After executing si, RIP moves to 0x40100a, and RBX contains 0x14 (decimal 20).
The next instruction is at address 0x40100a:
mov rcx, rax
Before executing this instruction, RCX still contains its previous value. Now, let’s use si again to execute it. This instruction copies the value from RAX into RCX.
Notice that executing mov rcx, rax does not remove or change the value in RAX. RAX still contains 0xa (decimal 10), and RCX now also contains 0xa (decimal 10). This is because the mov instruction copies the value from one register to another without changing the source register.
As shown in the screenshot, both RAX and RCX contain the same value: 0xa (decimal 10).
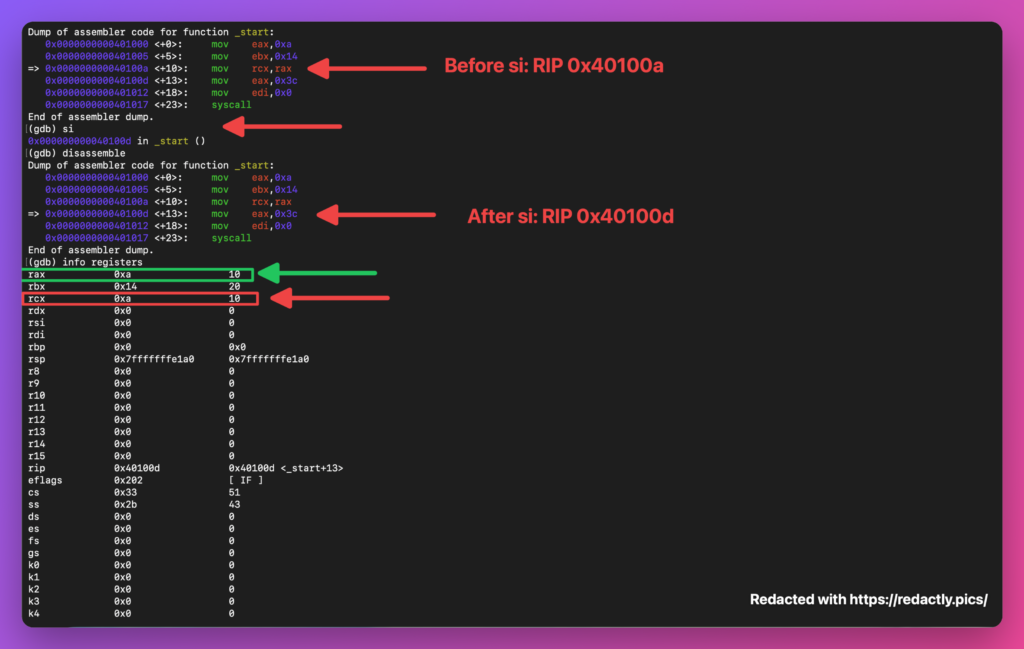
As you can see, the RCX register contains 0xa (decimal 10), which was copied from RAX by the instruction mov rcx, rax. You can see this instruction in the gdb.nasm source file and in GDB’s disassembly output.
The current RIP is at address 0x40100d. Now, let’s use the si command to execute the next instruction:
mov eax, 0x3c
In our original gdb.nasm file, this instruction is written as mov rax, 60. GDB displays it as mov eax, 0x3c because decimal 60 is equivalent to hexadecimal 0x3c, and the assembler uses a 32-bit register instruction for this value.
Remember, EAX represents the lower 32 bits of RAX. Writing to EAX also clears the upper 32 bits of RAX. After this instruction executes, RAX will contain 0x3c (decimal 60), replacing its previous value of 0xa (decimal 10).
You can verify this by checking the RAX register again in GDB. or see the attached screenshot
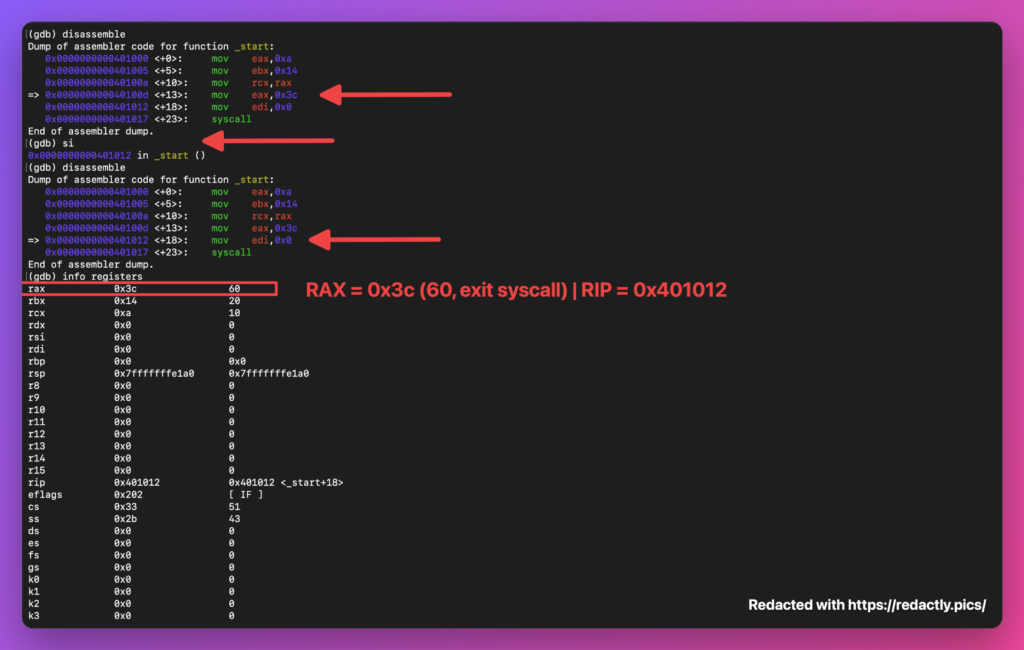
Now, let’s look at the final two instructions. The mov edi, 0x0 instruction sets RDI to 0, which is the exit status we want to pass to Linux. Since RAX already contains 0x3c (decimal 60), the system call number for exit, the program is ready to terminate.
When we use the si command, GDB executes mov edi, 0x0 and moves RIP to 0x401017, where the syscall instruction is located.
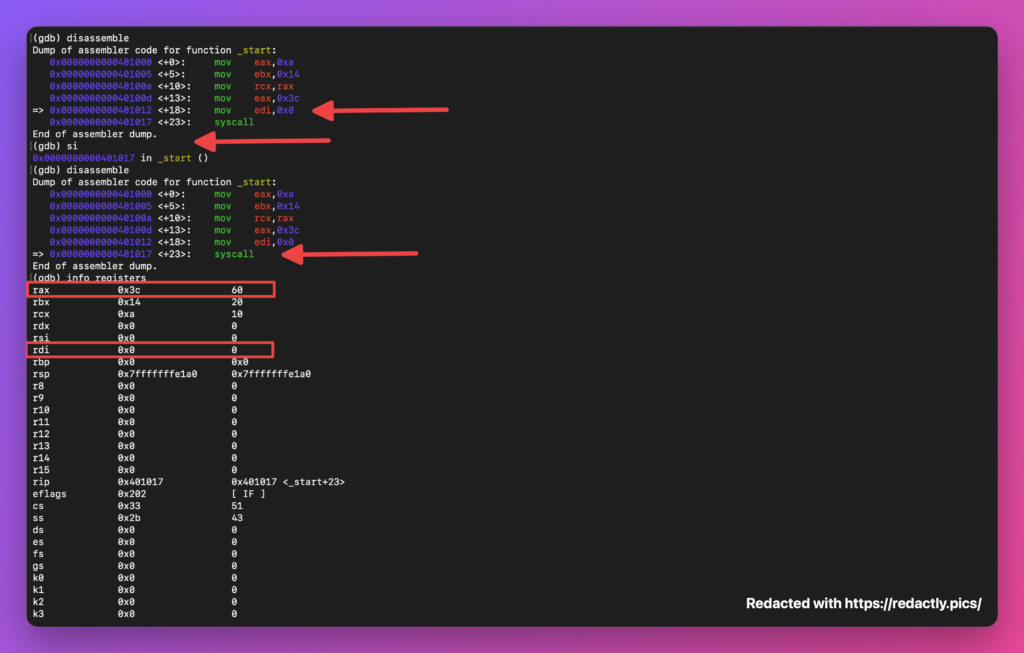
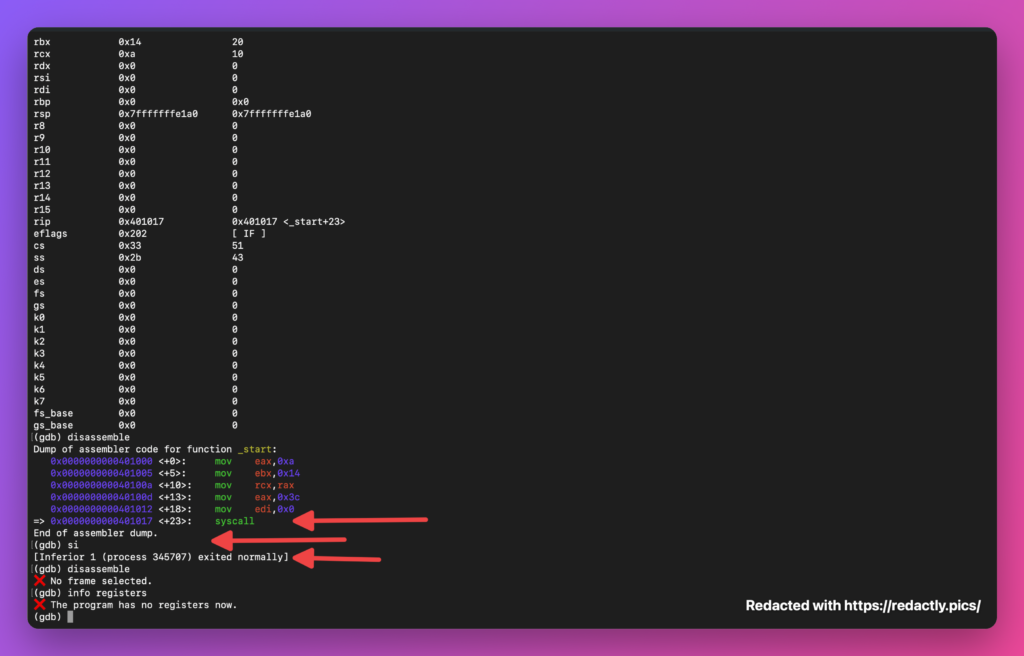
Running si one more time executes syscall, which asks Linux to terminate the program with exit status 0. The program exits normally, and GDB can no longer inspect its live registers or current instruction because the process has ended.
Conclusion
In this write-up, we learned how to use GDB to debug an x86-64 Assembly program. We used commands such as break, run, disassemble, si, and info registers to execute instructions one by one and inspect CPU register values at runtime.
We also learned about the => symbol in GDB, which points to the current instruction, and the RIP register, which holds the instruction pointer. By stepping through our program, we observed how instructions such as mov change register values and how the syscall instruction terminates the program.
Now, try creating your own Assembly program and debugging it with GDB. Experiment with different instructions, inspect the registers, and observe how the program executes step by step.
Thanks for reading! See you in the next x86-64 Assembly write-up.

![ASM[03] — [x86-64] Assembly Language: Understanding Instructions, Registers and the read Syscall](https://appsecwriteups.com/wp-content/uploads/2026/10/Screenshot-2026-10-05-at-9.59.41-AM-150x150.png)